“
”Markets in Focus
Timely analysis of market moves and sectors of opportunity
The U.S. economy and equities defied expectations through most of 2024, but the market’s mood changed in December.
Watch for this shift to foreshadow a higher-volatility bull market in 2025.
Keep an eye on earnings growth and the other fundamentals that have been the foundation of the equity market’s strength.
Heading into 2024, consensus was predominantly bearish. Investors broadly expected a U.S. recession and roughly seven interest rate cuts. Instead, consumer spending didn’t falter. Corporate earnings held up. Capital expenditures (capex) related to artificial intelligence continued and even accelerated.
Whether responding to high valuations, a concentrated market, or fears of an economic slowdown, investors who sat out to avoid the downside in 2024 ended up missing out on the upside, said Joey Del Guercio, Market Strategy Research Associate at Raymond James Investment Management.
With two trading days remaining in the year, the S&P 500 is up 25.18% in 2024. That would be its:
best year since 2021 (26.89%),
26th best year since World War II,
fifth-best year of this millennium, and
the first time since the 1990s when the index returned more than 20% two years in a row. It’s worth mentioning that the S&P 500 actually had four 20% years in a row from 1995 to 1998, and 1999’s 19.53% return almost brought that streak to five.1
“This market is not in uncharted waters, and there’s scope for equities to continue higher,” Del Guercio said. “Don’t forget that the average bull market returns 181% over 1,921 days, and that currently the S&P 500 is up 67% so far over the past 807 days. I can certainly sympathize with the fact that it’s hard to stomach buying at the peak of the market, especially when it feels like the index has been defying gravity, but I believe the fundamental backdrop for equities remains constructive and the path of least resistance continues to be higher.”
While 2024 has been an extraordinary year for equities, Del Guercio said December has felt like a mood change. The expansion of breadth stalled, and post-election “Trump trade” winners such as small caps and financials have given up all or most of their gains and are trading at pre-election levels. The December Federal Open Market Committee meeting reflected the change with a 25-basis point interest rate cut, hawkish commentary teeing up a pause in January, and two cuts on the summary of economic projection’s dot plot. U.S. Federal Reserve (Fed) Chair Jerome Powell seemed more uncomfortable than usual; there was dissent among the committee about whether to cut (i.e., for the first time since 2022, this cut was not a unanimous vote); and despite Powell saying previously that the committee wasn’t factoring in the incoming Trump administration’s expected policies, he acknowledged that “we expect significant policy changes” and that they are “thinking about these questions.” But Del Guercio said the S&P 500 plummeting -2.95% for its worst Fed day since 2001 — which was the Fed’s emergency meeting following the 9/11 attacks — felt like an overreaction.
“This felt like a ‘sell the news’ event as investors got what is probably the last cut for the time being and locked in some of their 2024 gains,” he said. This was exacerbated by the Fed’s surprising acknowledgement of the uncertainty that future policy injects into forecasts. Even though December’s usual “best month of the year” seasonality didn’t materialize this year, Del Guercio noted that 2024’s Santa Claus rally is shaping up to be better than average.
Del Guercio said December’s mood change likely foreshadows what we can expect going forward: a higher-volatility bull market underscored by “known unknowns.” The labor market could weaken, spelling recession. Index valuations are high. Indices are concentrated. Inflation could reaccelerate from future policy initiatives or already embedded growth. One of the wars could prove contagious. Trump could tweet something. It’s very likely that 2025 brings more bouts of volatility than we had in 2024, he said, but he believes these likely don’t affect the fundamentals that are grounding this bull market. The S&P 500 is expected to post nearly 15% earnings per share (EPS) growth in 2025, accelerating from 2024’s growth of about 10%. The outlook for breadth expansion is positive with the majority of 2025’s EPS growth coming from the S&P 493 (+13% year-over-year) instead of the Magnificent Seven (+21%). Net profit margins are expected to expand to 13% in 2025 from 2024’s already high 12%. Artificial intelligence (AI) applications offer further reason for optimism, he said. While rates might be higher for longer, investors can take solace in the fact that it’s highly unlikely we see any interest rate hikes next year.
“Be ready for headlines to move markets,” Del Guercio said. “Don’t be unprepared and panic. Think about preparing for and welcoming them as potential buying opportunities.”
With three days to go, 2024’s Santa Claus rally is better than average
S&P 500 returns during the last five trading days of the year and the first two of the next year
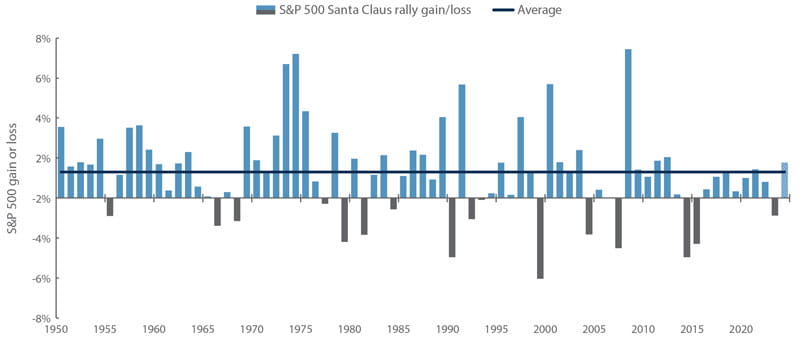
Source: Bloomberg, as of 12/27/2024.
S&P 500 EPS and revenue growth are expected to accelerate
S&P 500 historical EPS and revenue growth and 2024/2025 forecasts
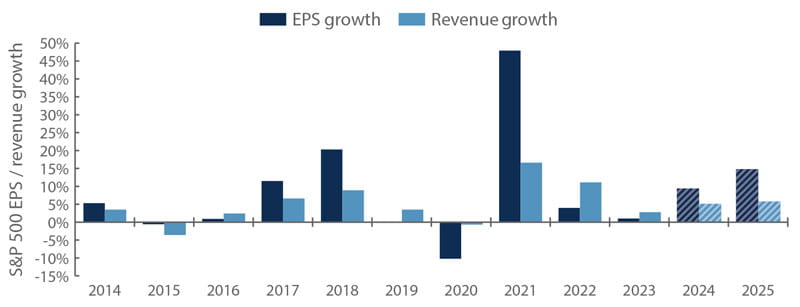
Source: FactSet, as of 12/20/2024.
The recent near government shutdown reflects many elements of the policy uncertainty to come, Del Guercio said. Given the prospect of heightened volatility going forward, he believes investors may want to consider building diversification in their portfolios, to think about using downside opportunistically to build long-term positions in this high-volatility bull market, to evaluate the potential of using quality and profitability to inform investment decisions, and to assess whether to position for breadth’s expansion both across sectors and down the market-cap spectrum. He favors seeking growth at a reasonable price (GARP) and considering select momentum names such as AI plays that have reset in December. His list of areas to focus on includes:
Small caps. While small caps have given up nearly all of their gains following the U.S. election, this stratum of equities continues to make higher highs and higher lows. Sentiment is turning around, exemplified by the last National Federation of Independent Business Small Business Optimism Index. The next earnings season is expected to showcase the Russell 2000® Index’s first quarter of positive year-over-year EPS growth for the first time in years, and estimates anticipate that 2025 will show the index post EPS growth outpacing the S&P 500. Small caps remain historically inexpensive relative to large caps.
Cyclicality. Like small caps, cyclicals have given up most of their post-election gains. The U.S. economy continues to surprise to the upside, and the next administration’s expected pro-growth agenda could continue to support cyclicals, Del Guercio said. Within the cohort, financials remain attractive given their exposure to capital markets where mergers and acquisitions (M&A) and initial public offering (IPO) activity could pick up from a new Federal Trade Commission regime and deregulation broadly. Financials are also expected to post the highest EPS growth within the S&P 500 in the coming fourth-quarter earnings season at approximately 40% year-over-year versus the next best’s growth of about 20% for communications services. Additionally, industrials are worth watching given their exposure to defense, artificial intelligence capex spending, and U.S. manufacturing and construction broadly.
Megacaps. They’re called the Magnificent Seven for a reason, Del Guercio said. The top of the index contains some of the biggest beneficiaries of AI with growth as open-ended as the internet’s was in the 1990s. While not completely homogenous, the high quality of the Magnificent Seven is exemplified by robust free cash flow margins, strong credit profiles, and standout EPS growth.
1 Unless otherwise indicated, all data cited is sourced from Bloomberg as of Dec. 27, 2024.
Risk Information:
Investing involves risk, including risk of loss.
Diversification does not ensure a profit or guarantee against loss.
Disclosures:
Index or benchmark performance presented in this document does not reflect the deduction of advisory fees, transaction charges, or other expenses, which would reduce performance. Indexes are unmanaged. It is not possible to invest directly in an index. Any investor who attempts to mimic the performance of an index would incur fees and expenses that would reduce return.
This document is a general communication being provided for informational purposes only. It is educational in nature and not designed to be taken as advice or a recommendation for any specific investment product, strategy, plan feature, or other purpose in any jurisdiction, nor is it a commitment from Raymond James Investment Management or any of its affiliates to participate in any of the transactions mentioned herein. Any examples used are generic, hypothetical, and for illustration purposes only. This material does not contain sufficient information to support an investment decision, and you should not rely on it in evaluating the merits of investing in any securities or products. In addition, users should make an independent assessment of the legal, regulatory, tax, credit, and accounting implications and make their own determinations together with their own professionals in those fields. Any forecasts, figures, opinions, or investment techniques and strategies set out are for information purposes only, based on certain assumptions and current market conditions, and are subject to change without prior notice. All information presented herein is considered to be accurate at the time of production, but no warranty of accuracy is given and no liability in respect of any error or omission is accepted. It should be noted that investment involves risks, the value of investments and the income from them may fluctuate in accordance with market conditions and taxation agreements, and investors may not get back the full amount invested. Both past performance and yields are not reliable indicators of current and future results.
The views and opinions expressed are not necessarily those of the broker/dealer or any affiliates. Nothing discussed or suggested should be construed as permission to supersede or circumvent any broker/dealer policies, procedures, rules, and guidelines.
Sector investments are companies engaged in business related to a specific sector. They are subject to fierce competition and their products and services may be subject to rapid obsolescence. There are additional risks associated with investing in an individual sector, including limited diversification.
Investing in small cap stocks generally involves greater risks, and therefore, may not be appropriate for every investor. The prices of small company stocks may be subject to more volatility than those of large company stocks.
International investing presents specific risks, such as currency fluctuations, differences in financial accounting standards, and potential political and economic instability. These risks are further accentuated in emerging market countries where risks can also include possible economic dependency on revenues from particular commodities or on international aid or development assistance, currency transfer restrictions, and liquidity risks related to lower trading volumes.
Definitions
Basis points (bps) are measurements used in discussions of interest rates and other percentages in finance. One basis point is equal to 1/100th of 1%, or 0.01%.
Breadth describes the relationship between the median and the mean of a market index. When a few data outliers result in a mean that is substantially larger (or smaller) than the median of the full data set, then the performance of the entire index is being driven by a “narrow” selection of companies. An index supported by “broad” market movements is one where the median is closer to the mean. Market breadth is said to narrow when a smaller number of more extreme outliers drive the mean of an index further from its median.
Capital expenditures, or capex, are monies used by a company to buy, improve, or maintain physical assets such as real estate, facilities, technology, or equipment, and may include new projects or investments.
Concentration is a term used to describe the extent to which investments in a portfolio, group of portfolios, industry, sector, index, or particular geography or clustered in groups that share specific factors or other characteristics.
A consensus estimate is a forecast of a public company’s projected earnings, the results of a particular industry, sector, geography, asset class, or other category, or the expected findings of a macroeconomic report based on the combined estimates of analysts and other market observers that track the stock or data in question.
Cyclical stocks have prices influenced by macroeconomic changes in the economy and are known for following the economy as it cycles through expansion, peak, recession, and recovery.
The dot plot is a chart summarizing the Federal Open Market Committee’s (FOMC) outlook for the federal funds rate. Each dot represents the interest rate forecasted by one of the 12 members of the committee.
Earnings per share (EPS) is calculated as a company’s profit divided by the outstanding shares of its common stock. The resulting number serves as an indicator of a company’s profitability.
The Federal Open Market Committee (FOMC) consists of 12 members: the seven members of the Board of Governors of the Federal Reserve System; the president of the Federal Reserve Bank of New York; and four of the remaining 11 Reserve Bank presidents, who serve one-year terms on a rotating basis. The FOMC holds eight regularly scheduled meetings per year at which it reviews economic and financial conditions, determines the appropriate stance of monetary policy, and assesses the risks to its long-run goals of price stability and sustainable economic growth.
Growth investing is a stock-buying strategy that focuses on companies expected to grow at an above-average rate compared to their industry or the market.
Growth at a reasonable price (GARP) is a stock investment strategy that seeks to combine tenets of both growth and value investing in the evaluation and selection of individual stocks. GARP investors look for companies with consistent earnings growth above broad market levels but try to avoid companies with very high valuations. By trying to avoid the extremes of either growth or value investing, GARP investors often end up focusing on growth-oriented stocks with relatively low price-to-earnings multiples in normal market conditions.
Hawkish, dovish, and centrist are terms used to describe the monetary policy preferences of central bankers and others. Hawks prioritize controlling inflation and may favor raising interest rates to reduce it or keep it in check. Doves tend to support maintaining lower interest rates, often in support of stimulating job growth and the economy more generally. Centrists tend to occupy the middle of the continuum between tight (hawkish) and loose (dovish) monetary policy.
Known unknowns refer to identified areas of potential risk with uncertainty surrounding the timing, scope of impact, or path of development for those risks.
The Magnificent Seven refers to the seven largest stocks by market capitalization in the S&P 500 Index, as of Dec. 29, 2023. Collectively they made up more than 25% of the market capitalization of the entire index. They are Alphabet, Amazon.com, Apple, Meta Platforms, Microsoft, NVIDIA and Tesla.
Market capitalization, or market cap, refers to the total dollar market value of a company’s outstanding shares of stock.
Mega-cap stocks are the largest publicly traded companies as measured by market capitalization. Generally, this refers to companies with market capitalizations over $200 billion.
Momentum investing is a strategy that aims to capitalize on the continuance of an existing market trend. It is a trading strategy in which investors buy securities that are already rising and look to sell them when they look to have peaked. It entails taking long positions on financial instruments with prices trending up and short positions on instruments with prices trending down.
The National Federation of Independent Business’s Small Business Optimism Index surveys small and independent business owners on 10 equally weighted and seasonally adjusted variables, including their hiring, investment, and inventory plans, as well as on their economic expectations, assessment of the state of the economy, labor market, credit conditions, and earnings trends. The monthly change of each variable contributes proportionally to the overall monthly change in the index.
A net profit margin, often shortened to net margin, measures how much net income or profit a company generates as a percentage of revenue. It can be expressed as a percentage or a decimal.
Quality investing is a strategy that seeks to invest in companies with low debt, stable earnings, consistent asset growth, and strong corporate governance, as reflected in financial metrics such as ratios of return to equity and debt to equity, as well as to earnings variability.
The S&P 493 refers to the constituents of the S&P 500 Index outside of the seven largest companies by market capitalization.
A Santa Claus rally refers to the tendency of the S&P 500 Index to see gains during the last five trading days in December of a given calendar year and in the first two trading days in January of the following year.
Seasonality refers to predictable changes that occur over a one-year period in a business, market, market sector, or economy based on the season, including calendar or commercial seasons.
“Sell the news” is part of a common saying in securities trading: “Buy the rumor. Sell the news.” Traders who focus on news try to make profits through timely trading that anticipates or reacts to news about a company or other market-moving development.
The summary of economic projections is produced following meetings of the Federal Open Market Committee and includes meeting participants’ projections of the most likely outcomes for real gross domestic product growth, the unemployment rate, and inflation for a forward-looking three-year window and over the longer run.
Trump trade refers to the expectation that policies and actions of the Trump administration could benefit certain areas of the capital markets.
Indices
The S&P 500 Index measures change in stock market conditions based on the average performance of 500 widely held common stocks. It is a market-weighted index calculated on a total return basis with dividend reinvested. The S&P 500 represents approximately 80% of the investable U.S. equity market.
The Russell 2000® Index measures the performance of the 2,000 smallest companies in the Russell 3000® Index, which represents approximately 7% of the total market capitalization of the Russell 3000® Index.
London Stock Exchange Group plc and its group undertakings (collectively, the “LSE Group”). ©LSE Group 2024. FTSE Russell is a trading name of certain of the LSE Group companies. Russell® is a trademark of the relevant LSE Group companies and is used by any other LSE Group company under license. All rights in the FTSE Russell indexes or data vest in the relevant LSE Group company which owns the index or the data. Neither LSE Group nor its licensors accept any liability for any errors or omissions in the indexes or data and no party may rely on any indexes or data contained in this communication. No further distribution of data from the LSE Group is permitted without the relevant LSE Group company’s express written consent. The LSE Group does not promote, sponsor, or endorse the content of this communication.
M-661274 Exp. 4/30/2025